Moment 01
A live operations dashboard unifying project kanban, delivery analytics, roadmap, portfolio health checks, a knowledge base, Docker fleet telemetry, and working automation controls in one installable app.
Real-Time Workspace Command Center
A live operations dashboard unifying project kanban, delivery analytics, roadmap, portfolio health checks, a knowledge base, Docker fleet telemetry, and working automation controls in one installable app.
“Turned a multi-project workspace into one glanceable, operable surface — no demo data, everything live.”
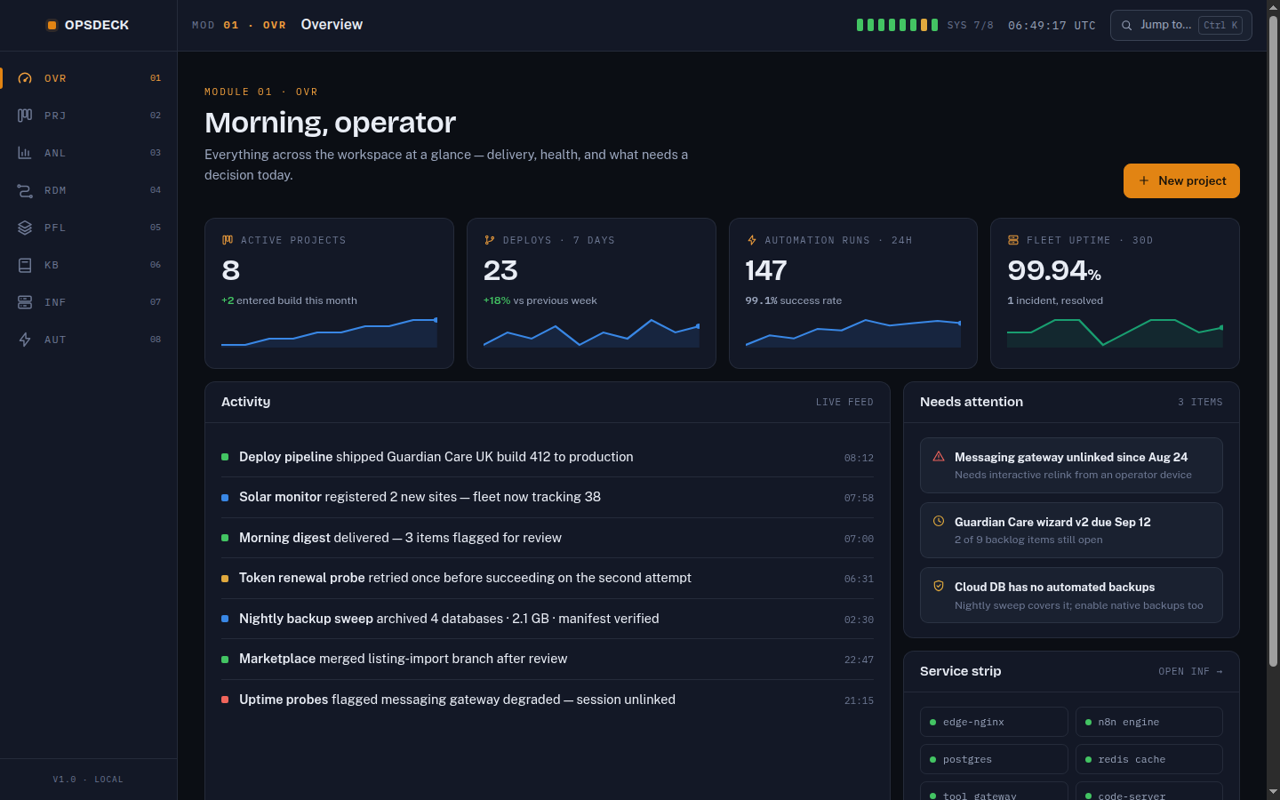
I run a workspace with a dozen active projects, forty-plus containers across hosts, scheduled jobs, and client sites that all need watching. The state of that world lived in terminal commands: container status here, timer schedules there, uptime checks somewhere else. Opsdeck started from a simple demand I set for myself — a dashboard where every number on screen is real, every control does something, and the whole thing installs on a phone.
A live operations dashboard unifying project kanban, delivery analytics, roadmap, portfolio health checks, a knowledge base, Docker fleet telemetry, and working automation controls in one installable app.
A zero-dependency Node backend and a hand-built SVG interface, verified by a 67-check end-to-end suite before every milestone.
Replaced scattered terminal checks and SSH sessions with one live control surface for projects, containers, automations, and site health.
Dashboards are easy to fake and hard to make honest. Most internal dashboards decay into static mockups because wiring live infrastructure — container stats, service managers, log parsers, health probes — is the unglamorous half of the work. The specific challenges were querying Docker and systemd safely from a web process, keeping cold loads fast when a stats sweep can take seconds, persisting board state without a database, and exposing the tool securely to mobile without opening a single public port.
Fleet Visibility
Ad-hoc terminal commands per host
Scheduled Jobs
Remembered schedules, silent failures
Access
Desktop terminal sessions only
I built a loopback-only Node 22 server with collectors for the container runtime, service scheduler, log archives, and live HTTP health checks, plus JSON-file stores for the kanban and roadmap. The frontend is dependency-free JavaScript with hand-drawn SVG charts, crosshair tooltips, a command palette, keyboard navigation, and slide-over detail drawers. It ships as an installable PWA over a private mesh network with TLS, and an 8-module interface covers overview, projects, analytics, roadmap, portfolio, knowledge base, infrastructure, and automations.
The unlock was treating the operating system itself as the database. Container state, scheduler timers, session history, and git metadata already exist as structured, queryable truth — the backend's job is validation, caching, and shaping, not storage. A thin zero-dependency Node server with per-collector caches made every module live without a heavy stack, and racing slow collectors against a deadline kept first paint under a second even on cold caches.
Zero-dependency Node 22 API
OS-as-database Collectors
Outcome metrics stay visible while comparison details are compressed into large readable cards instead of long stacked panels.
Ad-hoc terminal commands per host
One live view with drill-down to logs
Explore the operating layers and the shipped feature set in the same wider content frame used across the full case study.
Live Docker fleet view — per-container CPU, memory, health, port maps, and log tails
Working automation controls that start and stop real scheduled jobs, with journal drill-downs
Server-persisted kanban and roadmap enriched with live git branch and commit state per project
Click-through detail drawers on every data point: containers, deploys, sessions, and site checks